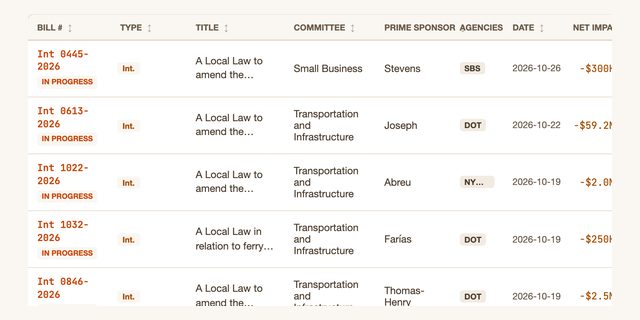
Council bills and resolutions whose fiscal impact statement put a price on them: every local law enacted since 2014, plus pending bills from 2026 (Legistar's search does not reach earlier pending bills). Each bill counts once, at its annual cost in a year of full implementation; pilots count over the years their statement prices.
Not counted in the annual figures: 17 bills whose statement prices the whole life of a program or plan, totalling $1.2B in cost and $60.5M in revenue over their full runs. The largest: Int 1557-2019 ($744.2M), Int 0692-2026 ($324.9M), Int 0449-2014 ($42.0M). Capital spending is also kept separate because it is a one-time outlay: 16 bills carry $1.8B in capital, the largest Int 1557-2019 ($997.1M), Int 0353-2024 ($605.0M), Int 0401-2018 ($54.0M).
The figures above cover the 423 enacted laws and adopted resolutions. Across all 481 bills with a statement, 423 are enacted or adopted, 6 passed the Council and await the mayor's signature, 35 are still moving through the Council, 0 lapsed or failed, and 17 older records have no matched Legistar page.
Views in this tool
The tracker at a glance
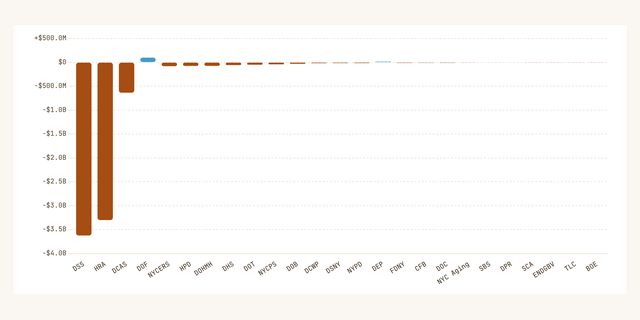
Annual operating cost of bills by the agency responsible, top 12. A bill with several agencies counts toward each.
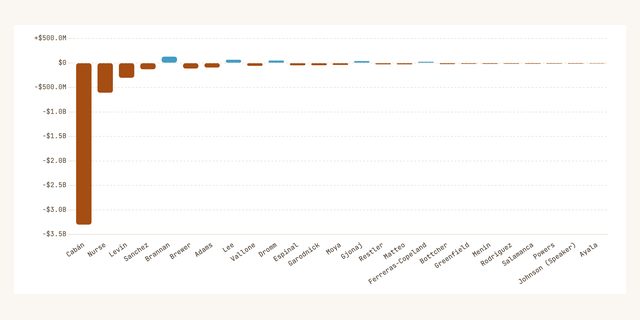
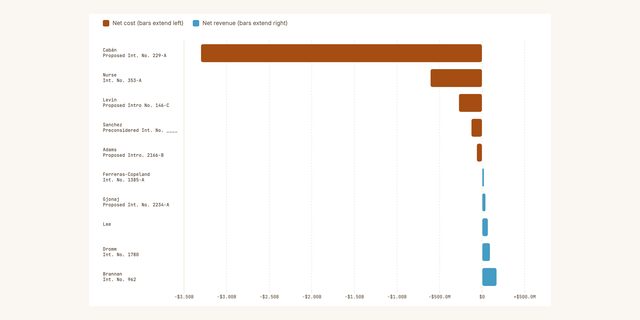
Combined annual operating cost of bills by prime sponsor, top 10.
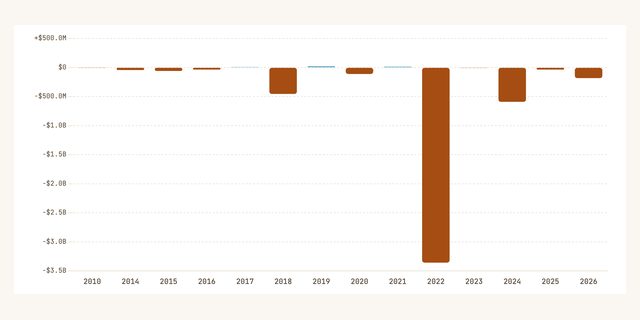
Combined annual operating cost by the year the bill was introduced.
Bills by the sign of their net fiscal impact. 4 bills share a package statement counted once on another bill and carry no figure of their own.
Source: Author's analysis of NYC Council fiscal impact statements from NYC Legistar, extracted and structured by NYCuriosity.